Event History & Trends
Event History
The Event History tab provides a log of events and actions related to all your Nautobot Instances. This includes instance creation, updates, restarts, and other significant actions. This log shows you when each event occurred, the type of event, and which instance it pertains to, the initiator, the interface used (e.g. API, Web UI), and the status of the event (Started, Completed, or Failed).
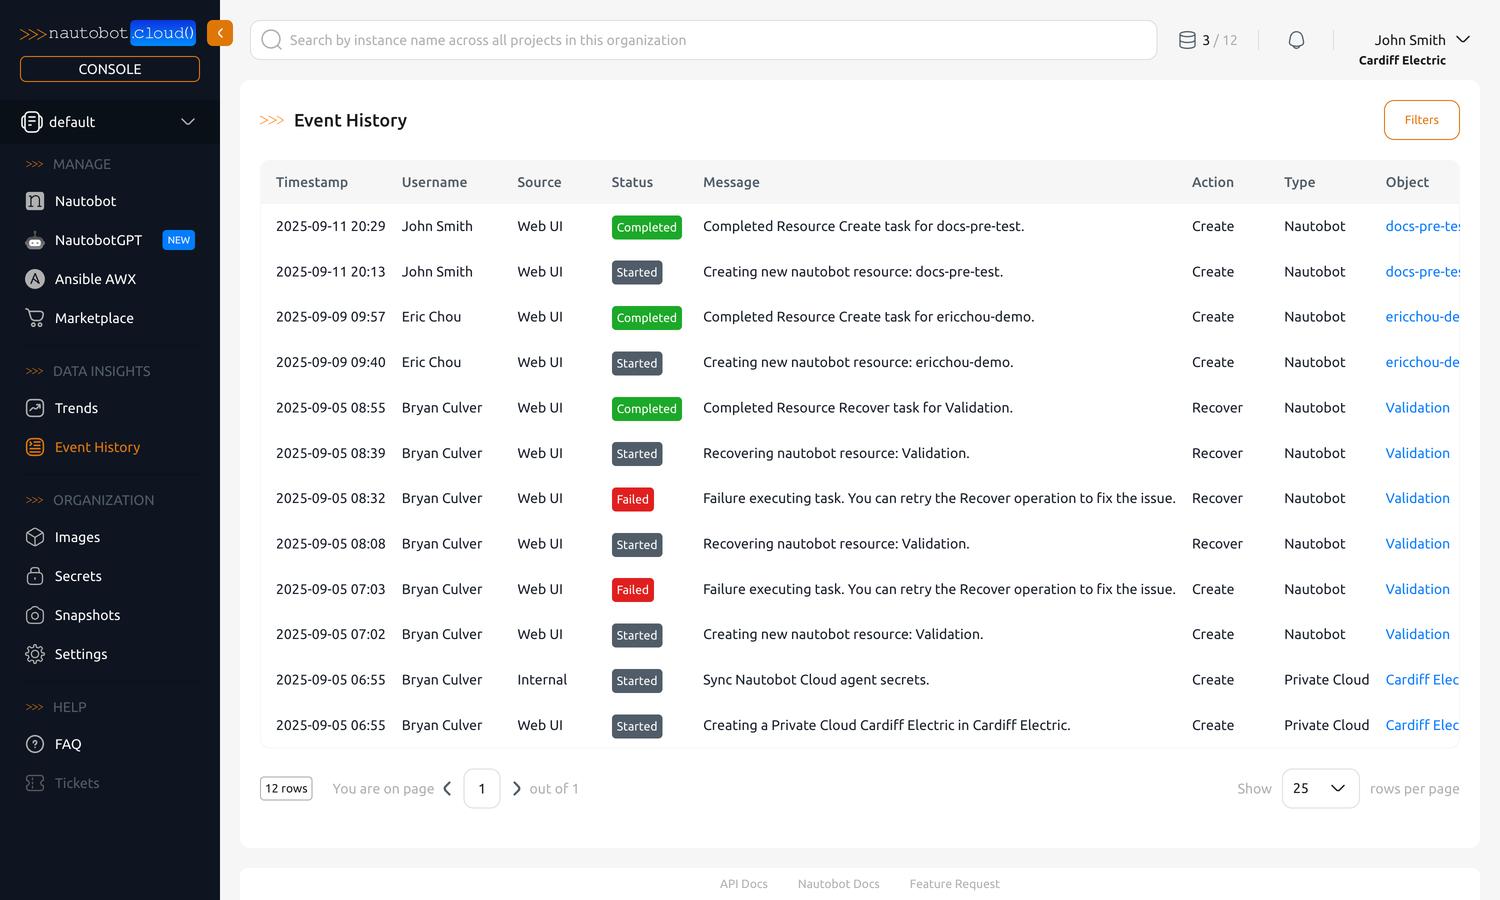
Filters (top right) can be applied to narrow down the events shown based on criteria such as event type, instance name, initiator, and date range.
Diagnosing a Failed Build
Any event with a Failed status includes a See details link — the fastest way to find out why an action didn't succeed. This is especially useful for a failed image build after a customization: the build runs in the background, so the reason it stopped is captured in the event rather than shown on the running instance.
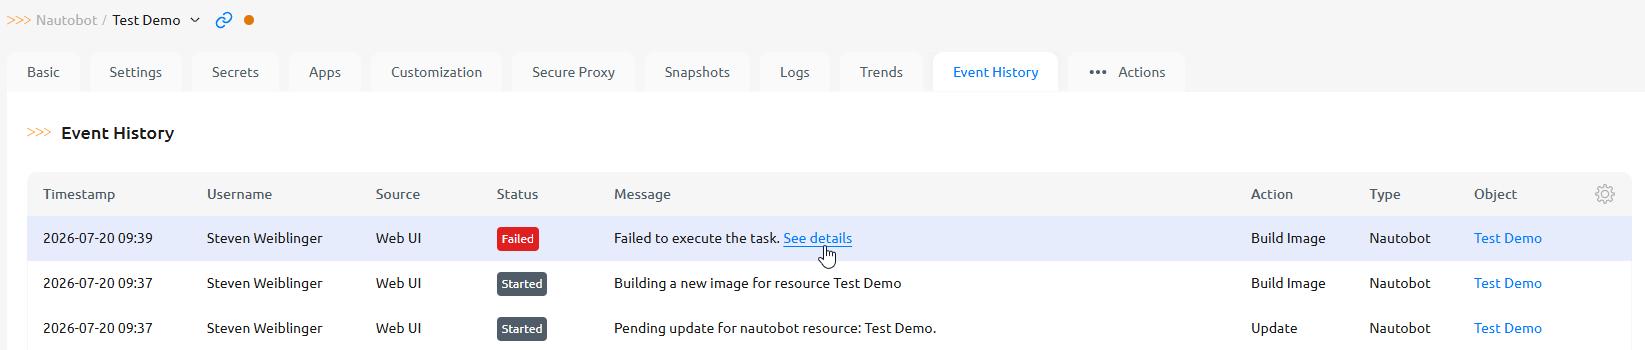
Click See details to open the full Build Image Log for that action. It shows the build output — including the exact error that stopped it, such as a pip dependency conflict or an unresolvable package version:
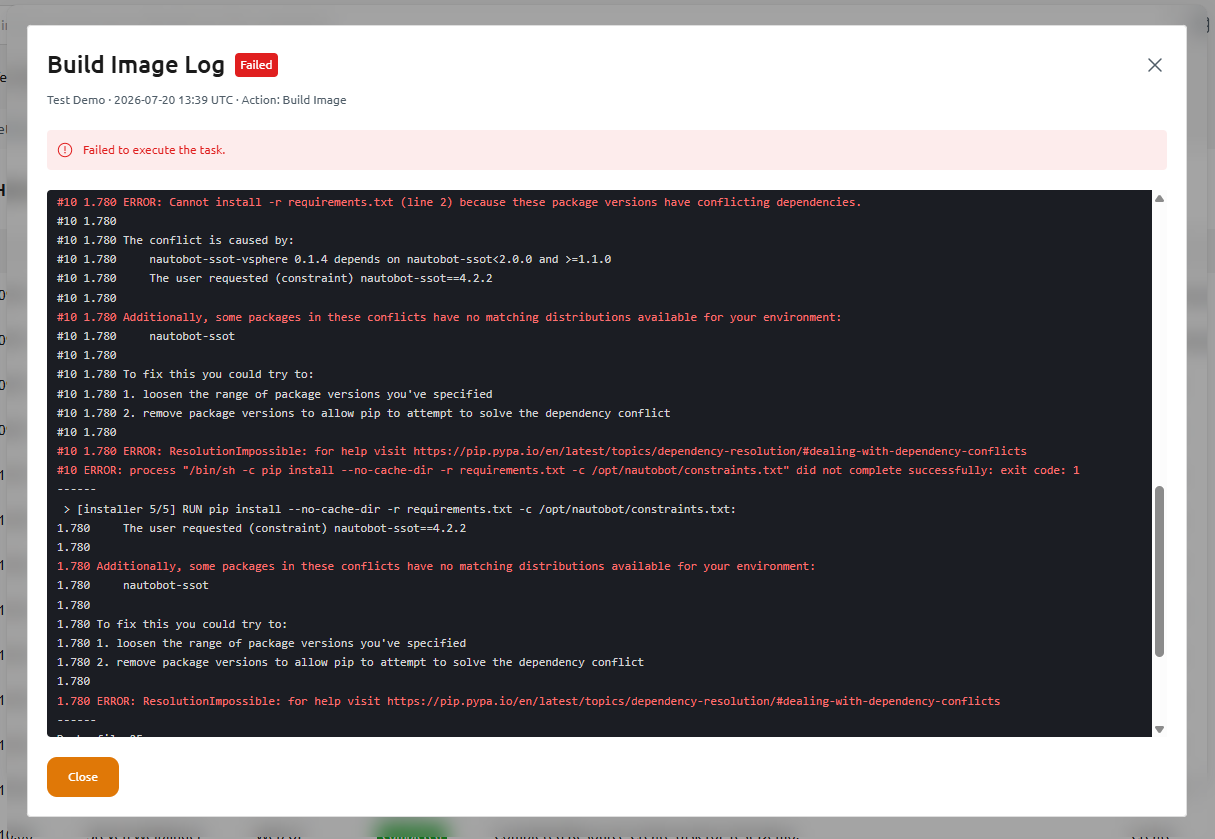
Read the log to identify the cause, correct the underlying customization — for example a pip dependency's version constraint or an uploaded static file — then Update the instance again to retry the build. A build failure leaves your running instance untouched; see If Something Goes Wrong for the full picture.
Trends
While the Event History tab tracks events related to your instances, the Trends tab provides a view inside your instances, showing performance metrics, device statistics, regional breakdowns, and more.
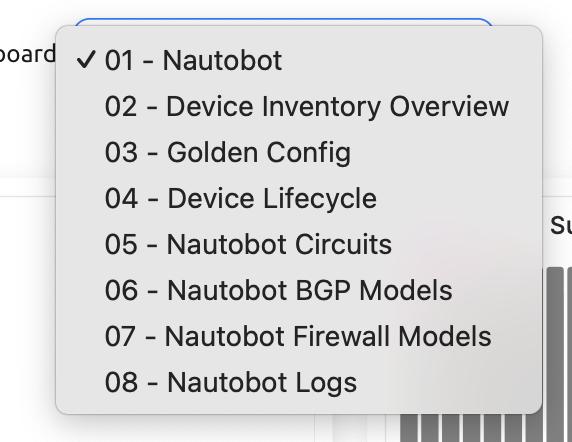
There are eight dashboards available to choose from, each available from the "Dashboard" dropdown menu at the top of the page.
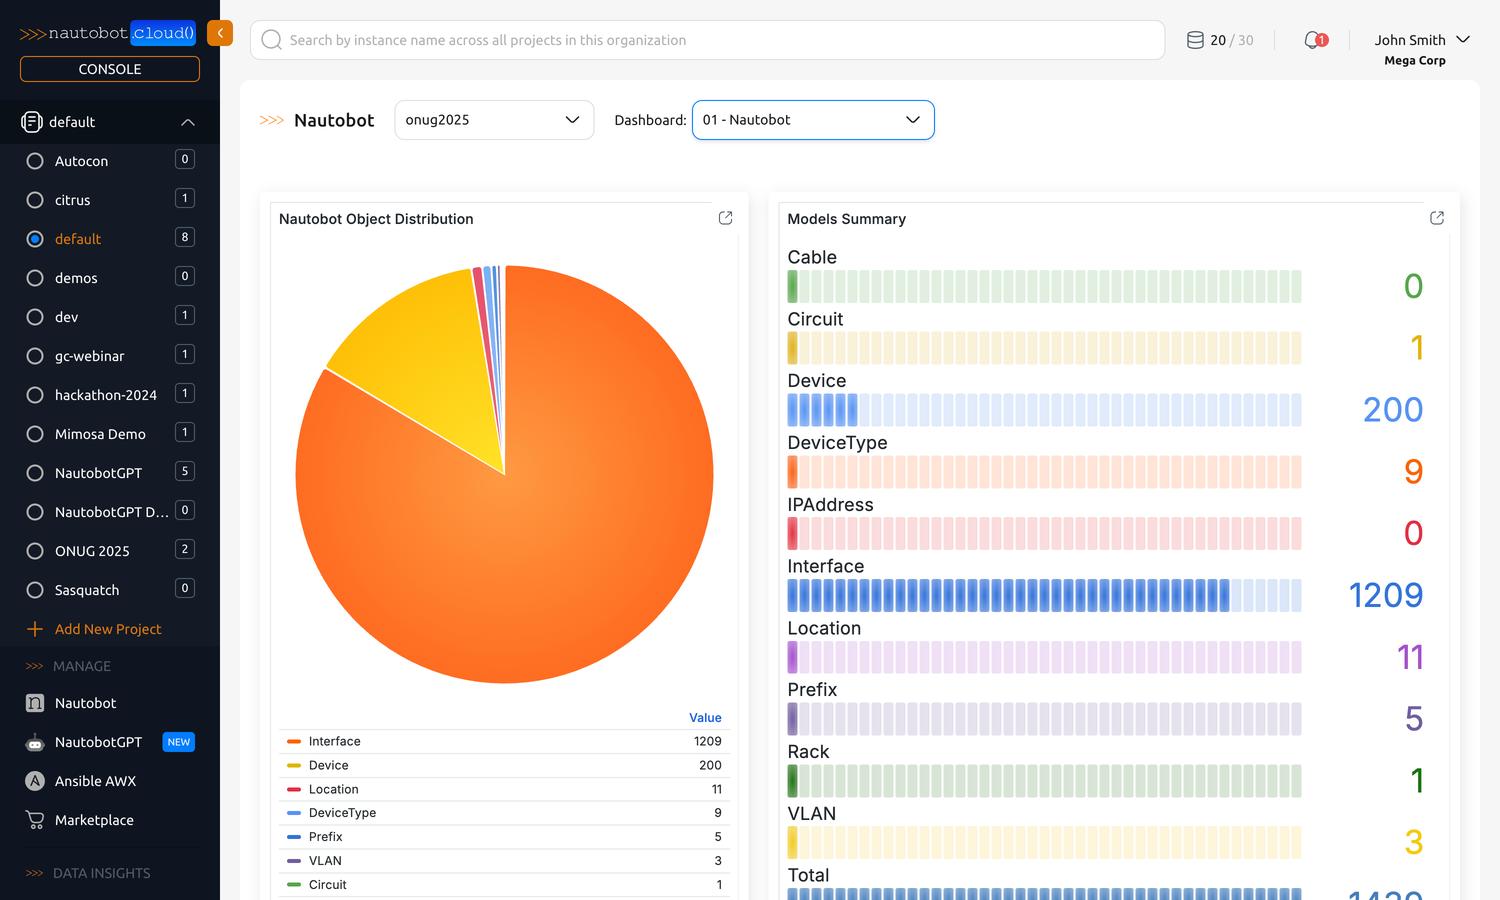
Dashboards
The dropdown input labeled "Dashboard" at the top of the Trends page allows you to select from eight dashboards, each providing different insights into your Nautobot Instances.
| Dashboard Name | Description |
|---|---|
| 1. Nautobot (Instance overview) | High-level overview of your Nautobot Instances, breaking down the distribution of objects by type |
| 2. Device Inventory Overview | Overview of devices broken down by location, status, and manufacturer |
| 3. Golden Config | Status of configuration compliance for devices |
| 4. Device Lifecycle | Tracking of devices at the end of their lifecycle |
| 5. Nautobot Circuits | Status of circuits in Nautobot broken down by provider |
| 6. Nautobot BGP Modules | Tracking of Border Gateway Protocol pairings and statistics |
| 7. Nautobot Firewall Modules | Tracking of firewall rules and statistics |
| 8. Nautobot Logs | Log streams from Nautobot instances and Jobs |