Getting Started with the App
This document provides a step-by-step tutorial on how to get the App going and how to use it.
Install the App
To install the App, please follow the instructions detailed in the Installation Guide.
Insights Dashboards
Insights dashboards are available immediately after installation. To access them, navigate to Insights from the Nautobot navigation menu.
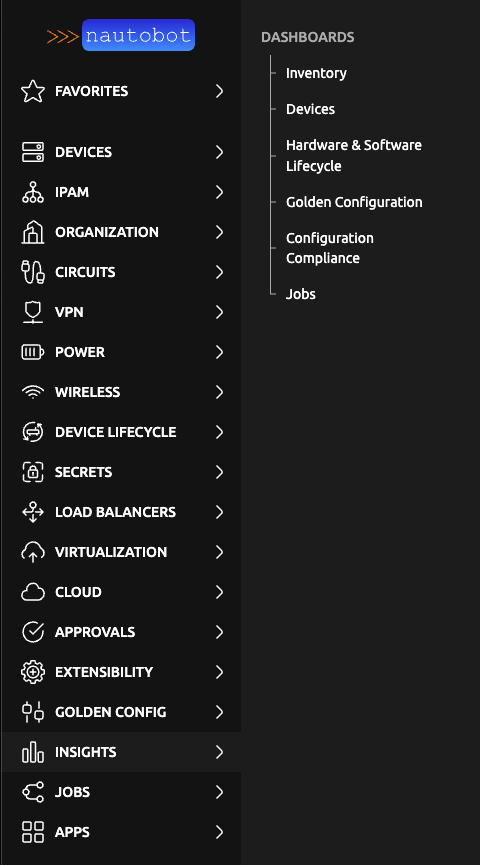
The following dashboards are available by default:
Inventory Insights
The Inventory Insights dashboard provides a high-level overview of all inventory objects in Nautobot. It displays total counts for devices, device types, manufacturers, circuits, racks, IP addresses, platforms, interfaces, modules, locations, and power infrastructure components. Distribution charts break down devices by type, circuits by provider, and locations by type.


Device Insights
The Device Insights dashboard provides detailed analytics on how devices are distributed across the environment. It includes breakdowns of devices by location, status, manufacturer, role, type, and tenant, making it easy to assess inventory composition and identify trends at a glance.


Job Insights
The Job Insights dashboard provides visibility into Nautobot job execution and performance. It tracks the job success rate and total jobs run over the last 24 hours, shows the count of enabled jobs, and charts job results by status, grouping, and name over the last 30 days.


Companion App Dashboards
The following dashboards require additional apps to be installed. If a required app is not installed, a splash page will be displayed in place of the dashboard indicating which app needs to be installed.
Golden Configuration Insights
Requires Nautobot App Golden Configuration.
The Golden Configuration Insights dashboard tracks configuration management workflows. It shows the percentage of fully compliant devices and features, total golden config jobs run and config plans completed over the last 30 days, and charts for config plans by plan type and golden config operation status.


Configuration Compliance Insights
Requires Nautobot App Golden Configuration.
The Configuration Compliance Insights dashboard provides detailed compliance metrics at both the device and feature level. It includes charts showing compliant versus non-compliant counts per feature and per device, along with a summary table listing the compliance percentage for each feature.


Hardware and Software Lifecycle Insights
Requires Nautobot App Device Lifecycle Management.
The Hardware and Software Lifecycle Insights dashboard provides visibility into end-of-life status and security vulnerabilities. It shows devices by hardware support status, counts of devices past key lifecycle milestones (end of sale, end of software releases, end of security patches, end of support), software validation status for devices and inventory items, and device exposure to CVEs by severity.


Network Tools
Network diagnostic tools are available as Nautobot Jobs. Before using them, an administrator must enable the jobs.
Accessing from the Jobs Page
Navigate to Jobs in the Nautobot navigation menu. The network tools will be listed under the Network Tools group.


Accessing from a Device or IP Address Detail Page
For a faster workflow, navigate directly to a Device or IP Address detail view and click the network tools button. This opens a job modal pre-filled with the target device or IP, allowing you to run the tool and view results directly in the modal without navigating away to a separate job result page.


For detailed information on each network tool, including prerequisites and usage, see the Network Tools documentation.
Troubleshooting Tools
From Nautobot (Instance Running)
Troubleshooting jobs are available from the Jobs page in Nautobot. Navigate to Jobs and look for the Troubleshooting Tools group. Both jobs produce a downloadable results file. The following jobs are available:
- TroubleshootingRunAllChecks — runs all enabled diagnostic checks.
- TroubleshootingRunCheck — runs a single check by name.


From the Command Line (Instance Down)
If the Nautobot instance is unavailable, the nautobot_troubleshooting CLI command can be run directly on the Nautobot host to collect diagnostics.