Installing the App in Nautobot
Here you will find detailed instructions on how to install and configure the App within your Nautobot environment.
Prerequisites
- The app is compatible with Nautobot 3.0.0 and higher.
- Databases supported: PostgreSQL, MySQL
Note
Please check the dedicated page for a full compatibility matrix and the deprecation policy.
Install Guide
Note
Apps can be installed from the Python Package Index or locally. See the Nautobot documentation for more details. The pip package name for this app is nautobot-capacity-metrics.
The app is available as a Python package via PyPI and can be installed with pip:
To ensure Metrics & Monitoring Extension App is automatically re-installed during future upgrades, create a file named local_requirements.txt (if not already existing) in the Nautobot root directory (alongside requirements.txt) and list the nautobot-capacity-metrics package:
Once installed, the app needs to be enabled in your Nautobot configuration. The following block of code below shows the additional configuration required to be added to your nautobot_config.py file:
- Append
"nautobot_capacity_metrics"to thePLUGINSlist. - Append the
"nautobot_capacity_metrics"dictionary to thePLUGINS_CONFIGdictionary and override any defaults.
# In your nautobot_config.py
PLUGINS = ["nautobot_capacity_metrics"]

# PLUGINS_CONFIG = {
#     "nautobot_capacity_metrics": {
#         "app_metrics": {
#             "gitrepositories": True,
#             "jobs": True,
#             "models": {
#                 "dcim": {
#                     "Site": True,
#                     "Rack": True,
#                     "Device": True,
#                     "Interface": True,
#                     "Cable": True,
#                 },
#                 "ipam": {
#                     "IPAddress": True,
#                     "Prefix": True,
#                 },
#                 "extras": {
#                     "GitRepository": True
#                 },
#             },
#             "queues": True,
#             "versions": {
#                 "basic": True,
#                 "plugins": True,
#             }
#         }
#     },
# }
Once the Nautobot configuration is updated, run the Post Upgrade command (nautobot-server post_upgrade) to run migrations and clear any cache:
Then restart (if necessary) the Nautobot services which may include:
- Nautobot
- Nautobot Workers
- Nautobot Scheduler
App Configuration
The app behavior can be controlled with the following list of settings:
| Key | Example | Default | Description |
|---|---|---|---|
app_metrics |
{"models": {"dcim": "Device": True}} |
{"models": {"dcim": {"Site": True, "Rack": True, "Device": True}, "ipam": {"IPAddress": True, "Prefix": True}}, "jobs": True, "queues": True, "versions": {"basic": False, "plugins": False} |
Specifies which metrics to publish for each app. |
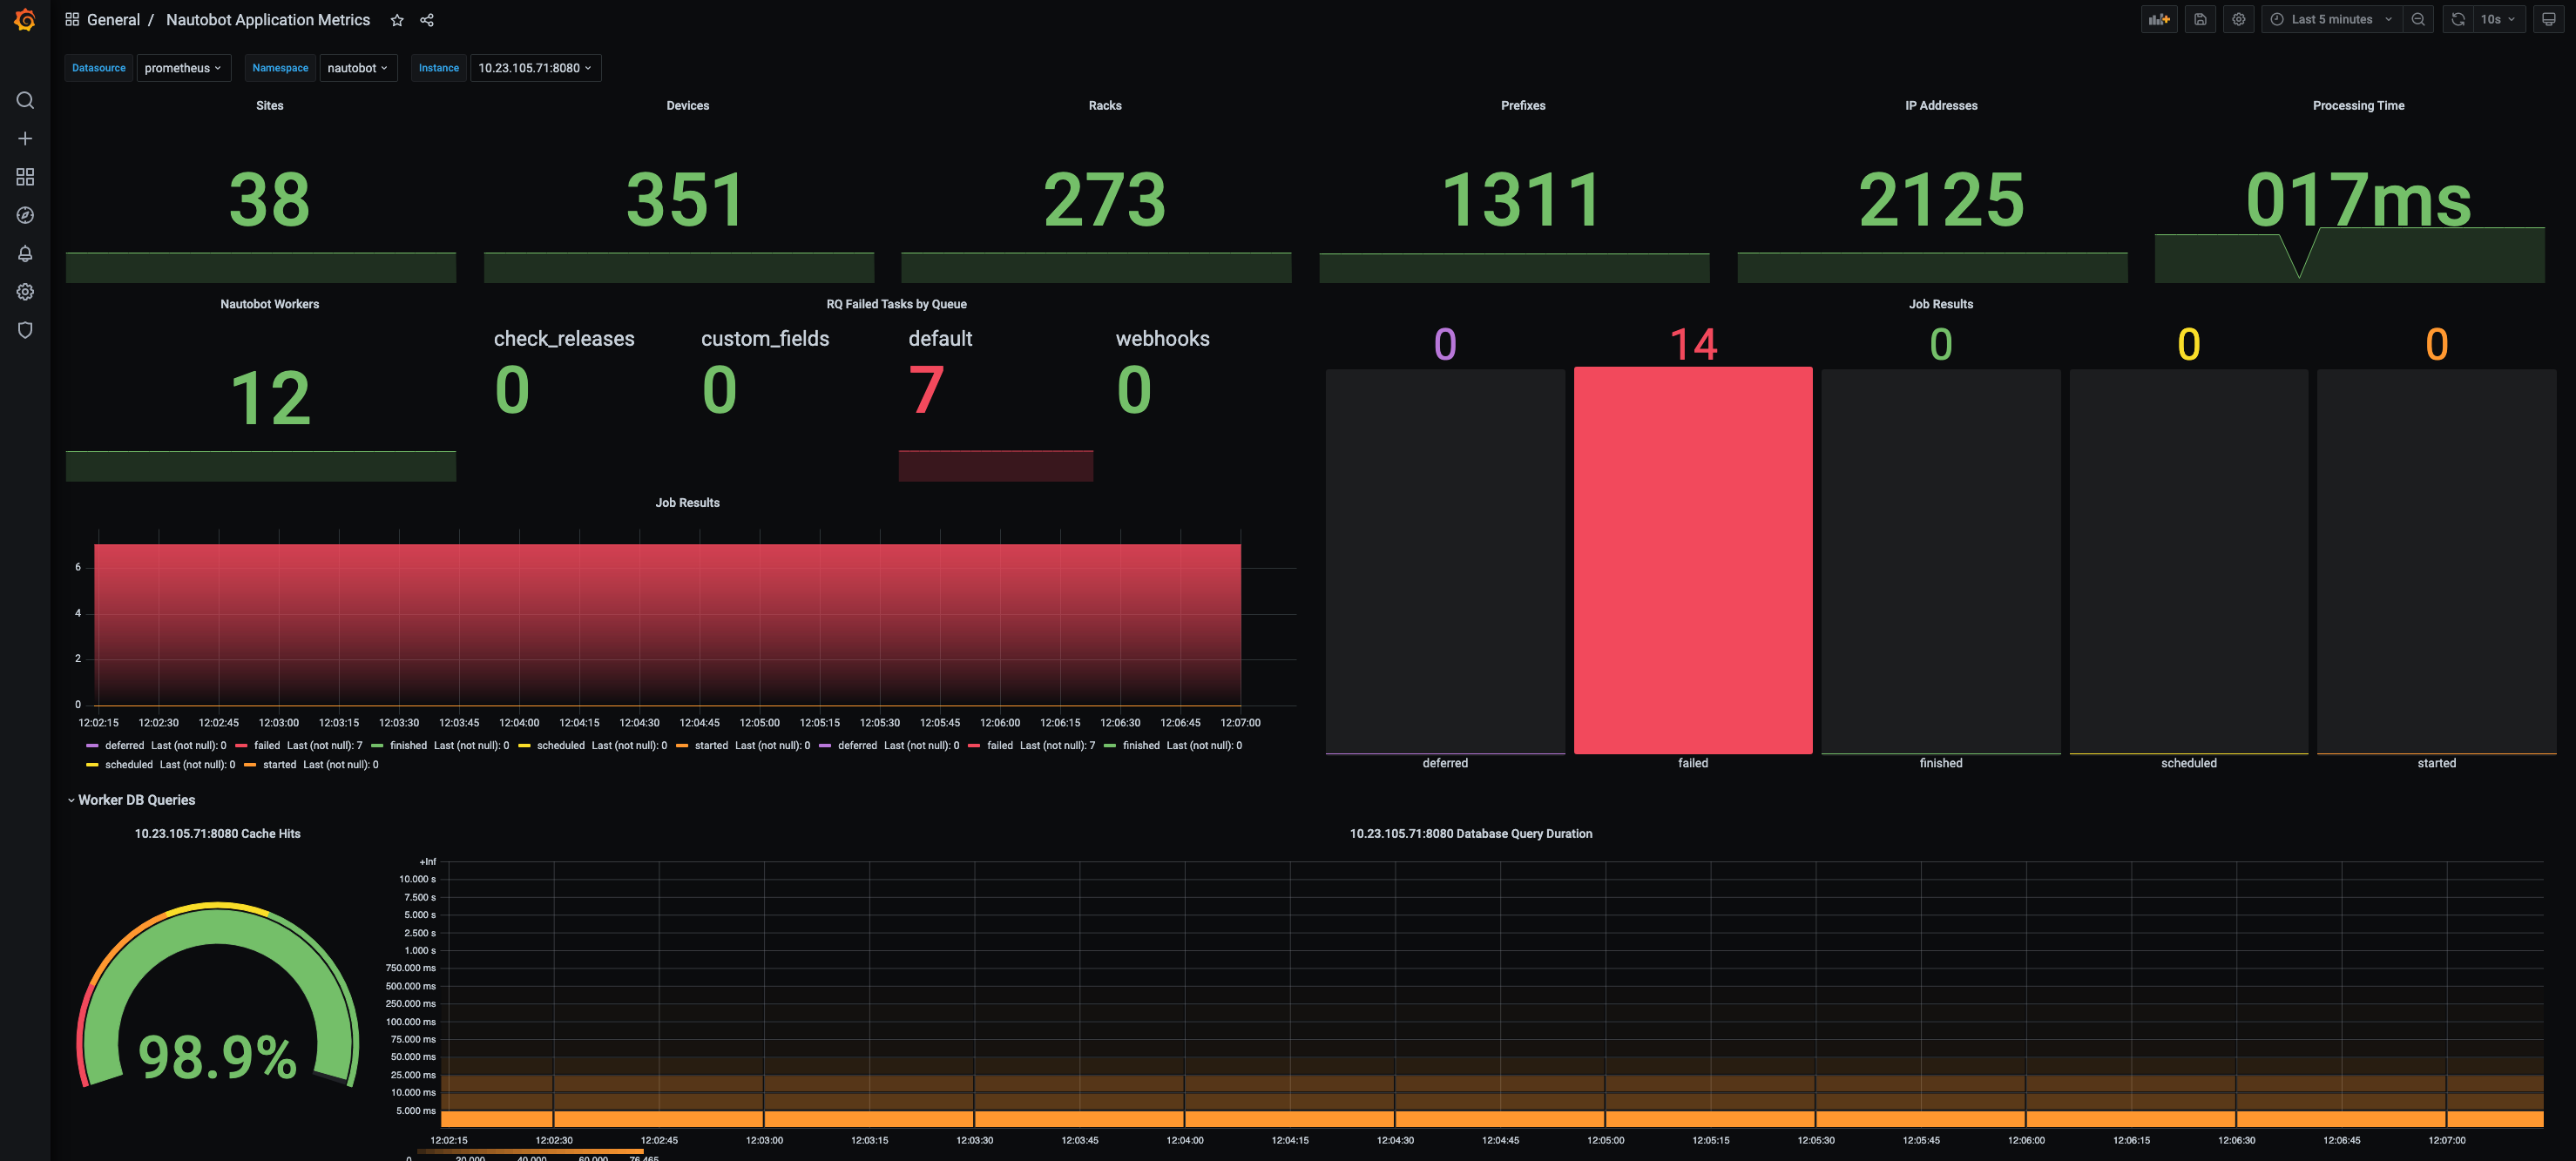
Included Grafana Dashboard
Included within this app is a Grafana dashboard which will work with the example configuration above. To install this dashboard import the JSON from Grafana Dashboard into Grafana.